
Part 1: What a WAF Monitor Taught Me About the Real Cost of a Public IP
Three minutes after DNS resolved, the first bot arrived. What a live WAF monitor showed me, and the drift I found when I finally looked.
By Mohammed jawed · · 13 min read

WAF Monitor
Part 1 of Security Without a Security Team, a 4-part series on the security controls behind live production systems at Mannat AI Labs.
Part 0: Security Without a Security Team
Three minutes
That is how long it took, after DNS first pointed at my server, before the first automated probe showed up in the access log. It was checking for .env at the site root. It found nothing, moved on, and was followed within the hour by dozens more just like it, from IP addresses spread across four continents.
I already knew, in the abstract, that the internet is hostile. Every security book, every hardening guide, every Hacker News post about a breach says the same thing: "Attacks are constant. Assume you are under attack." I had read it a hundred times. I did not really feel it until I stood up a small Web Application Firewall dashboard for the flagship system on the platform and watched the counter tick up in real time.
This is a story about that dashboard. What I built, what it showed me, and what I found about my own setup when I finally looked closely.
If you run any public-facing service, especially as a small team without a dedicated security engineer, I think you will find something useful here.
Why I care
The system in this story is the busiest one running under Mannat AI Labs, the umbrella I run my independent projects under. It is live, in production, used daily by a real team. When it goes down, work stops. When it gets compromised, trust is gone. There is no dedicated security team behind it. There is just me.
Part 0 lays that setting out in full. The short version: most security advice is written for organizations with people whose entire job is security. That is not most of us. Most of us are one or two engineers stretched across product, infrastructure, incident response, and, somewhere in there, the security posture. The question is not "how do I be perfect." The question is "what can I actually keep running, on the time I have, that gives me a fighting chance."
For me, the answer started with visibility.
The blind spot
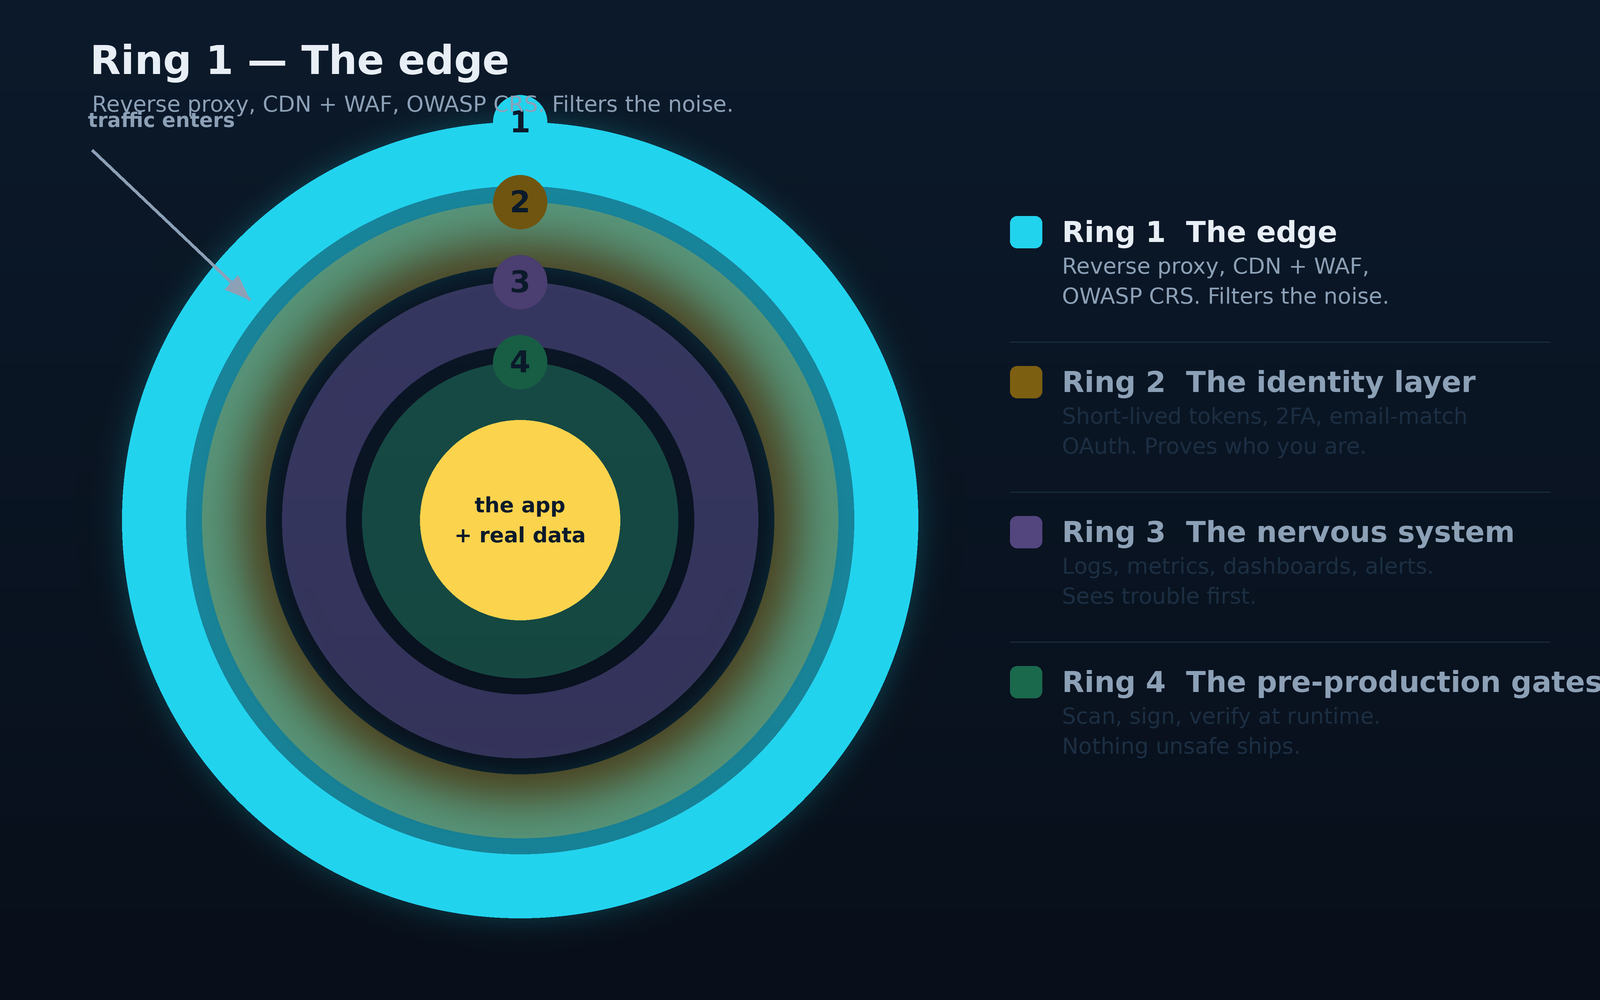
Like a lot of people, I had done the reasonable things. A managed CDN and WAF service in front of the origin. fail2ban on the box. Mod Security plus the OWASP Core Rule Set installed on nginx. TLS forced. Security headers set. A bunch of custom nginx rules aimed at the more obvious junk: direct hits on wp-admin, phpMyAdmin, .env, that whole neighborhood.
Then I got on with real work.
For months I told myself the WAF was doing its job. It probably was. It is a well-maintained rule set, run by a lot of people who know more than I do. But the honest truth is I had no idea what it was catching. There was an audit log somewhere on the disk. I glanced at it once when I set it up, saw it was a firehose of JSON, and never opened it again.
That is a very common failure mode. Set the WAF, walk away, and slowly forget it exists. Meanwhile:
You cannot tell real attacks from false positives that are quietly breaking real users.
You cannot see which vulnerabilities the internet is currently pounding on hardest.
You cannot spot a burst of activity from a single actor that might mean something targeted.
You cannot answer, when a partner or auditor asks, "what does your WAF actually do for you?" You just repeat that it is on.
The dashboard did not exist for other people. It existed because I got tired of not knowing.
What I built
The WAF Security Monitor lives inside the system's admin panel. It is deliberately small. Four ideas, that is it:
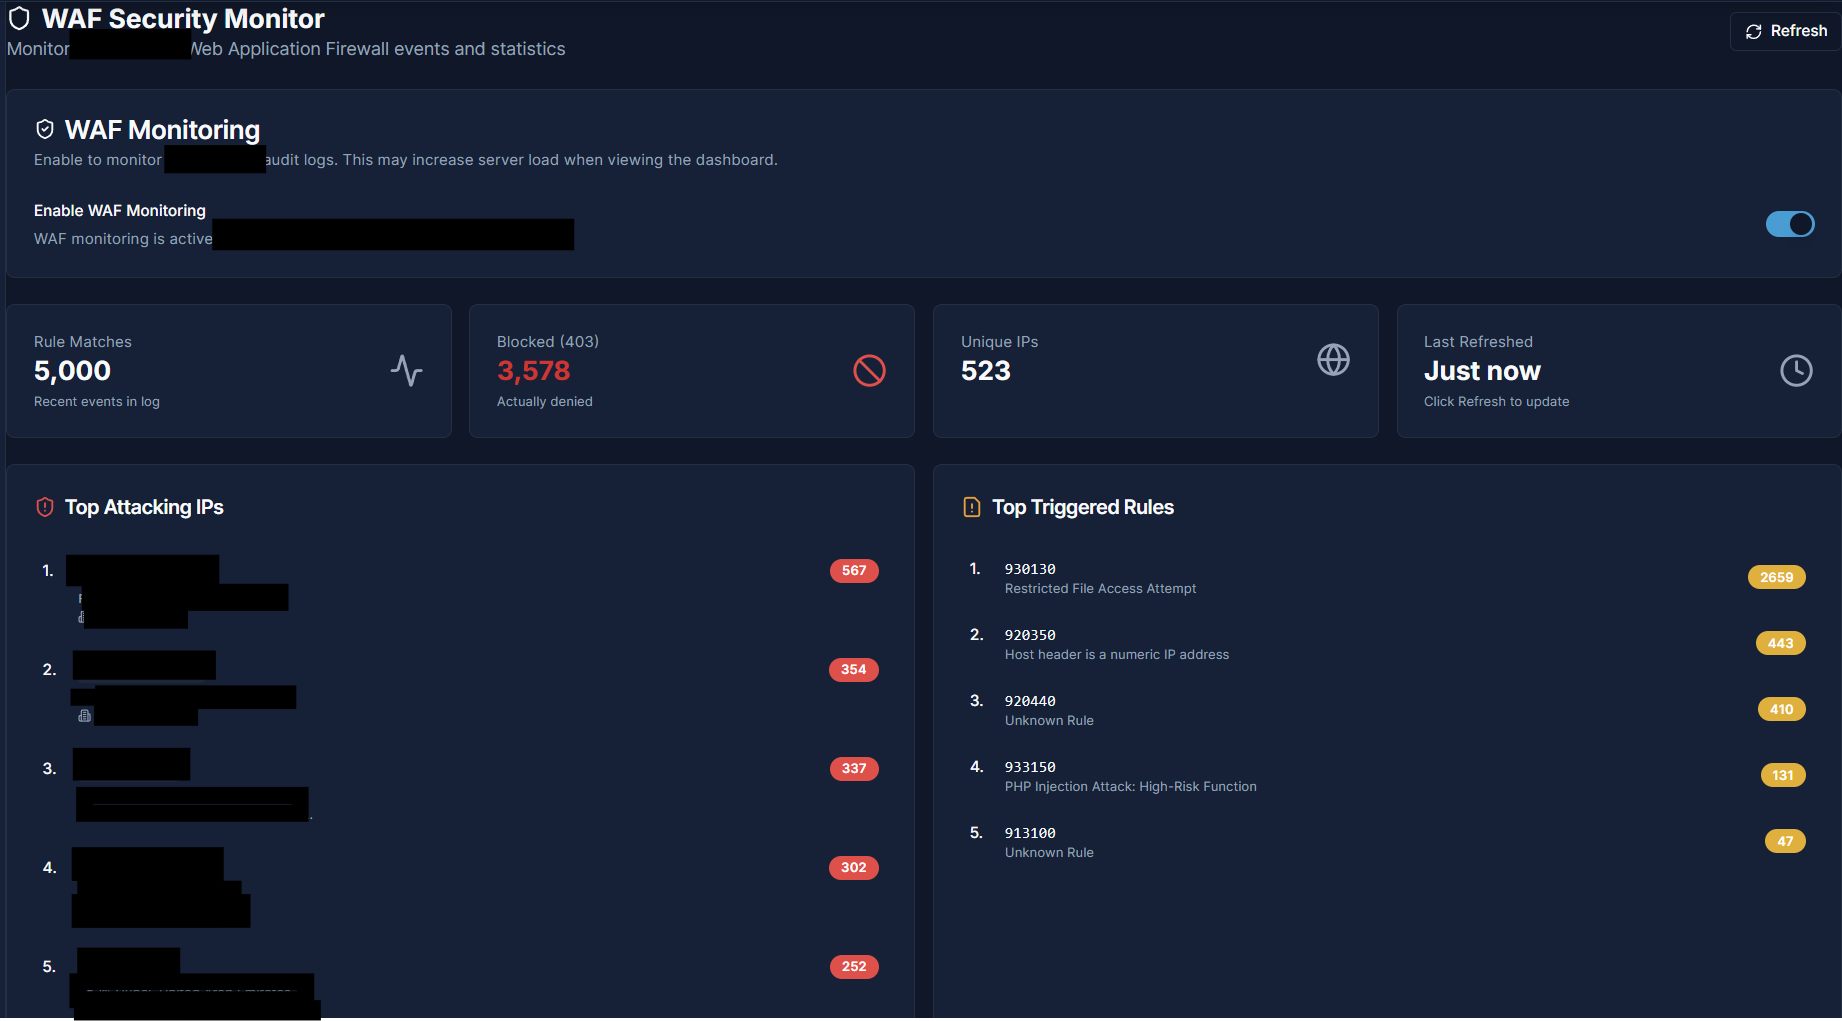
The four summary cards you land on. As of the screenshot: 5,000 rule matches, 3,578 of them actually blocked, from 523 distinct source addresses. On a modestly-trafficked server. That is the baseline.
Four summary cards. Rule matches, blocked requests, unique source IPs, and how fresh the data is. Nothing exotic, but seeing those numbers move on a live page is what turns a theoretical threat into a felt one.
Top attacking IPs, with geolocation. For each of the top offenders it shows the country flag, city, and the ISP or hosting company. Click an IP and the event log filters to just that source. This one feature has proven, week after week, to be the most useful thing on the page.
Top triggered rules. Ranked by how often they fire, with human-readable descriptions. Not "930130" but "Restricted File Access Attempt." That change from opaque number to plain English is what makes the list actionable.
A searchable event log. Every event with the timestamp, source IP, method, URI, and rule details. Three filter boxes at the top: IP, rule ID, URI. Anyone can investigate a specific incident in about five seconds.
That is the entire product. The backend is a small Node service that reads the ModSecurity audit log line by line, keeps a rolling window of recent events in memory, calculates the top-N lists, and looks up geolocation for the loudest sources, with enough caching that a free-tier geo API is all it needs. The frontend is React and Tailwind. Country flags render as Unicode regional indicator symbols, so no image assets are required.
Total build time, including the UI polish, was two evenings.
What the data actually showed
Within a few hours of turning it on, there were enough events to draw real conclusions. That surprised me. I expected to have to leave it running for a week before anything interesting emerged. Instead, the first afternoon told me everything.
Attack volume. Over a thousand rule matches from 168 unique IP addresses in a short window, on a modestly-trafficked server, during no special event. That is the baseline. There is no such thing as a "quiet" public server.
Attack composition. Five rules accounted for the vast majority of everything:
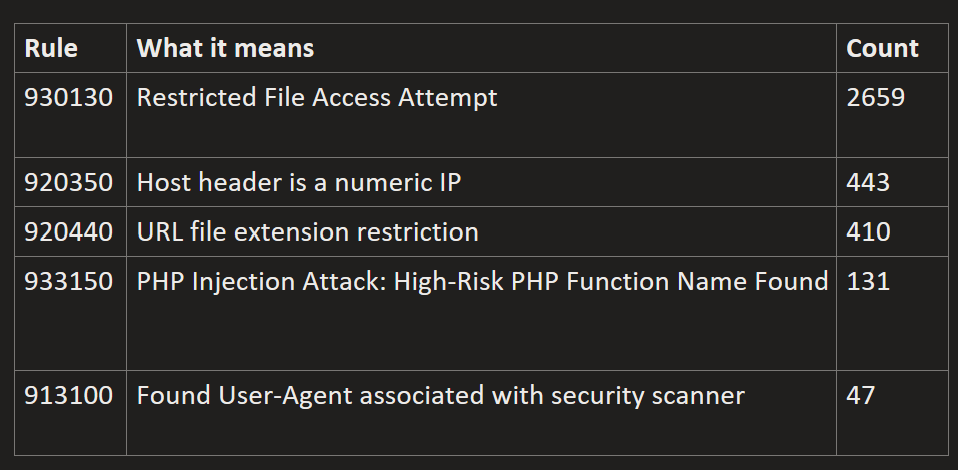
Rule 930130 dominates. Automated scanners systematically checking for .env, wp-config.php, config.yml, secrets.json, .sql.gz backups. A single exposed .env file can unlock a database, a payment gateway, an SMS provider, everything. The attackers know this. They spend their entire budget looking for it.
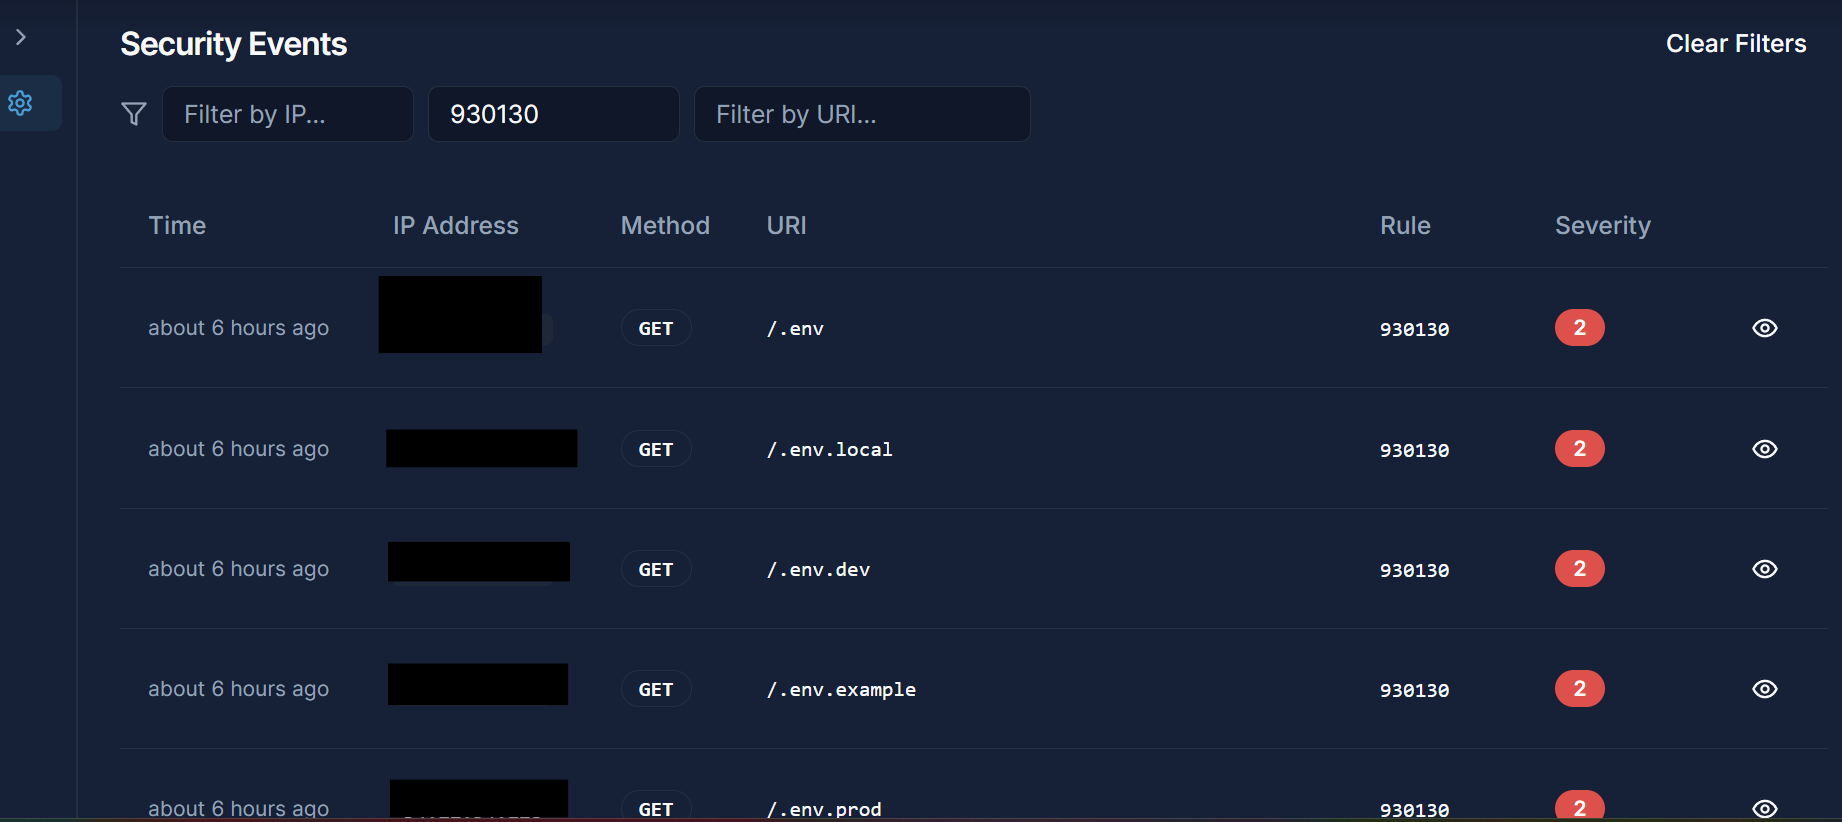
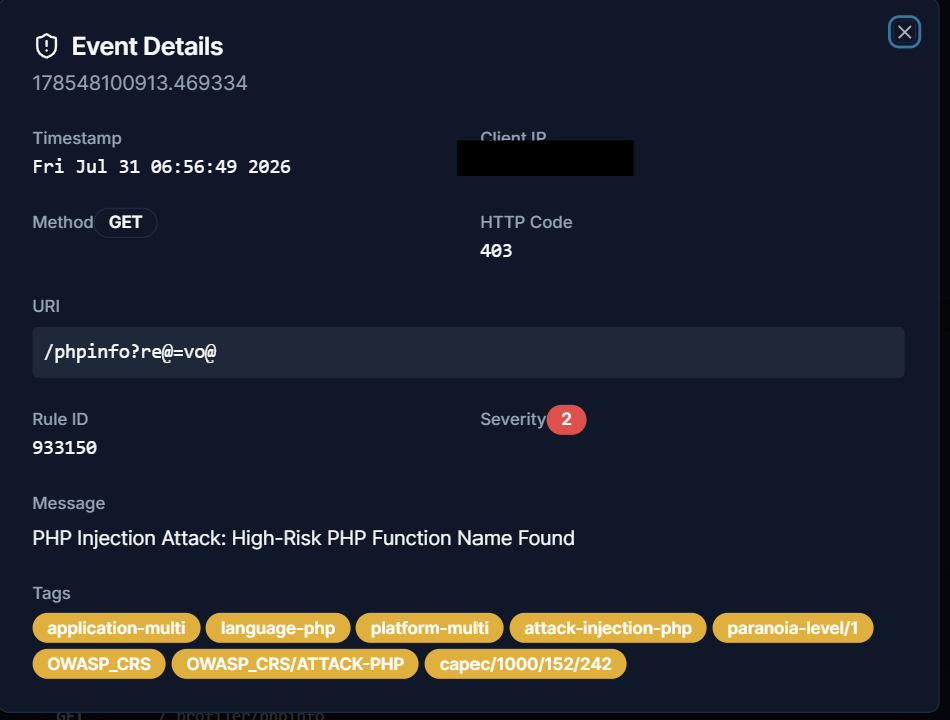
A live slice of the event log. Notice the pattern: the same source IP running through a list of well-known filenames. /.git/config, /.git/HEAD, /.well-known/.php, /config.php, /wp-content/config.php, /.env. This is not one attacker being clever; this is a script.*
Rule 920350 is the classic bot fingerprint. Legitimate browsers send the actual domain name in the Host header. Bots that do not bother to parse the DNS just send the IP. Whenever the Host header is a numeric IP, you are almost certainly looking at a scanner. It is a cheap, reliable signal.
Geographic and network patterns. This is where the geolocation column earns its keep. The heaviest single attacker was a consumer-ISP address that made a couple of hundred requests before backing off. But if you look past the country flag, most of the top attackers had a different shape entirely: a small cluster of IPs from a handful of hosting providers, some of them the same provider appearing more than once.
That is not "an attack from country X." That is a scanning operation renting VPS boxes from providers with permissive abuse policies. Once you see that shape, you make different decisions. You do not blindly geo-block; you look at ISP and autonomous system.
Left pane: the top five source addresses by rule matches, with country and ISP context (details redacted). Right pane: which OWASP CRS rules those requests are hitting. The rule IDs are from the public OWASP Core Rule Set. 930130 is "Restricted File Access Attempt," 920350 is "Host header is a numeric IP address."
Persistence. The same IPs come back day after day. The same tools produce the same fingerprints. If you stare at the log for an hour, you begin to recognize them. That familiarity is itself a useful skill. The day something different shows up, it stands out immediately.
The uncomfortable part
I want to tell you something now that I would prefer to skip, because it is embarrassing. But if I skip it, this piece stops being honest, and honest is the only reason to write it.
When I sat down to write this piece I did something I should have done long before: I audited my own layered defenses top to bottom. Not "read the docs and nod." I actually walked the config, vhost by vhost, header by header, and matched it against what I had been quietly telling myself was in place.
I found drift.
Nothing dramatic. No unpatched CVE, no exposed database. Just the mundane, cumulative kind of erosion that happens in every real production system over time. A control that was set correctly at first, then quietly stopped covering a new part of the platform after a copy-paste. A "temporary" permissive setting from an early debug session that stayed temporary for months. A control I would have sworn was in place uniformly, that turned out to be in place unevenly.
None of it was expensive to fix. What was expensive was noticing.
Before publishing this piece, I closed the gaps I found, tightened the layered posture across every vhost, and, importantly, wrote a small verification script that I now run on a schedule to catch this kind of drift the next time it appears. Because it will appear. The right response to drift is not "be more careful next time." It is "make the drift visible without requiring a person to remember to look."
That is really the whole point of a monitor, of a verifier, of any of this. It is a device for making yourself look.
The layered posture, as it actually stands today
For anyone thinking about doing something similar, here is where things now sit. The honest version, not the marketing version:
At the edge. A managed CDN in front of the origin handles DNS, DDoS scrubbing, and a first-pass bot filter. This soaks up most of the truly noisy traffic. But any origin whose real IP has ever appeared in DNS history is one search away from being bypassed. Edge protection is necessary and insufficient.
At nginx. A modern TLS baseline on every vhost, and the standard set of response-side security headers: HSTS, frame-options, content-type-options, referrer policy, permissions policy, and a Content Security Policy on the front-end. Real-client-IP trust pinned to the CDN's published address ranges, so that a header claiming "the real client is X" is only honored when the connection genuinely came from the CDN.
Handmade nginx rules. A small local rule set targeting the specific patterns the monitor shows most often. Kept short and quiet, with no ingredient list here, for the boring reason that the noisier these rules become the day they are documented publicly.
ModSecurity plus OWASP CRS. Attached to every public vhost. This is the layer that catches the categories of attack the handmade rules do not: SQL injection, XSS, path traversal, protocol violations. It uses a rule set maintained by a large community of people who spend their careers on it.
fail2ban:Jails watching the nginx and ModSecurity logs, with escalating ban durations. Short for a first offence, dramatically longer for repeat scanners. There is a dedicated jail specifically for .env probes that I find spectacularly satisfying to watch.
At the application. Rate limiting on the sensitive endpoints, with tighter caps on anything auth-related. Modern password hashing. Short-lived access tokens with rotating refresh tokens. Multi-factor authentication with backup codes. An admin-side capability for severing every active session for anyone leaving the team. Output sanitization for any user-generated content that leaves the system. All of this is Part 2 material.
At the observability layer. A log-shipping agent on the origin ships every container log across a private tunnel to a second VPS that runs the log store, metrics store, dashboards, and alerting. Alerts route to a messaging channel my phone monitors. If a disk fills up, if CPU pegs, if a database connection pool saturates, I know within a minute. Part 3 material.
In the pipeline. Every change clears a fail-closed gate before it is allowed to exist in production: secret scanning, static analysis, dependency review, type check, build. What the pipeline approves gets signed, and the runtime refuses to run anything that does not carry a valid signature. And a scheduled verification script opens the running production system and asserts that every claim in this list is still true. All of it is Part 4 material, including the day the gate went red five times and every one of them was real.
None of these layers is a silver bullet on its own. That is the point. Defence in depth is not a slogan; it is a lived, boring practice of assuming any one control might be bypassed and making sure at least three others still stand.
What surprised me most
Three things stayed with me from this whole exercise.
The internet has no grace period. Servers do not get to warm up. There is no polite window where you can finish configuring things before the scanning begins. Bots are cheaper than salaries; every IP range gets swept continuously by someone.
Most attacks are astonishingly boring. Ninety-plus percent of what I saw was the exact same checklist: .env, .git, wp-config.php, common admin paths, PHP file extensions on a Node stack. Which means that most of what a small team needs to do, most of the time, is defend against the boring stuff. If you master that, you have already deflected the huge majority of the traffic.
Visibility changes behavior more than any tool does. Everything I fixed in the uncomfortable section above was a five-minute config change. What was expensive was noticing. The dashboard is a five-hundred-line frontend and a few hundred lines of backend. Its real value is that it forces me, the operator, to look at the security posture with fresh eyes, at some cadence, for reasons other than an incident.
What's next in this series
Over the next three posts I will cover the rest of the layered posture in similar detail:
- Part 2: The Identity Layer. Short-lived access tokens, rotating refresh tokens hashed at rest, multi-factor authentication with backup codes, email-match-only single sign-on, and the one-call capability that severs every active session for anyone leaving the team.
- Part 3: From Silent Servers to a Real-Time View. How every container log ships from the origin to a second VPS over a private tunnel, how dashboards get provisioned as code, and how the alerts reach my phone without a per-seat SaaS bill.
- Part 4: The Pre-Production Gates. The fail-closed pipeline every change clears before production, the day it went red five times on a newly onboarded app, how the chain continues past the build with signed artifacts verified at runtime, and a generic verification-script template, free to lift into your own stack.
If any of this is useful to you, I would be glad to hear it. If you have done something better, or seen me miss something obvious, I would like to hear that even more.
A note on context: everything here describes independent projects run under Mannat AI Labs. Views and mistakes are entirely my own.