
Part 3: From Silent Servers to a Real-Time View
The disk filled at 4pm. I found out at 9pm. Going from a silent server to a real-time view of everything, without a per-seat SaaS bill.
By Mohammed jawed · · 12 min read
Part 3 of Security Without a Security Team, a 4-part series on the security controls behind live production systems at Mannat AI Labs.
Part 0: Security Without a Security Team
Part 1: What a WAF Monitor Taught Me About the Real Cost of a Public IP
Part 2: The Morning I Realized the Door Had No Lock
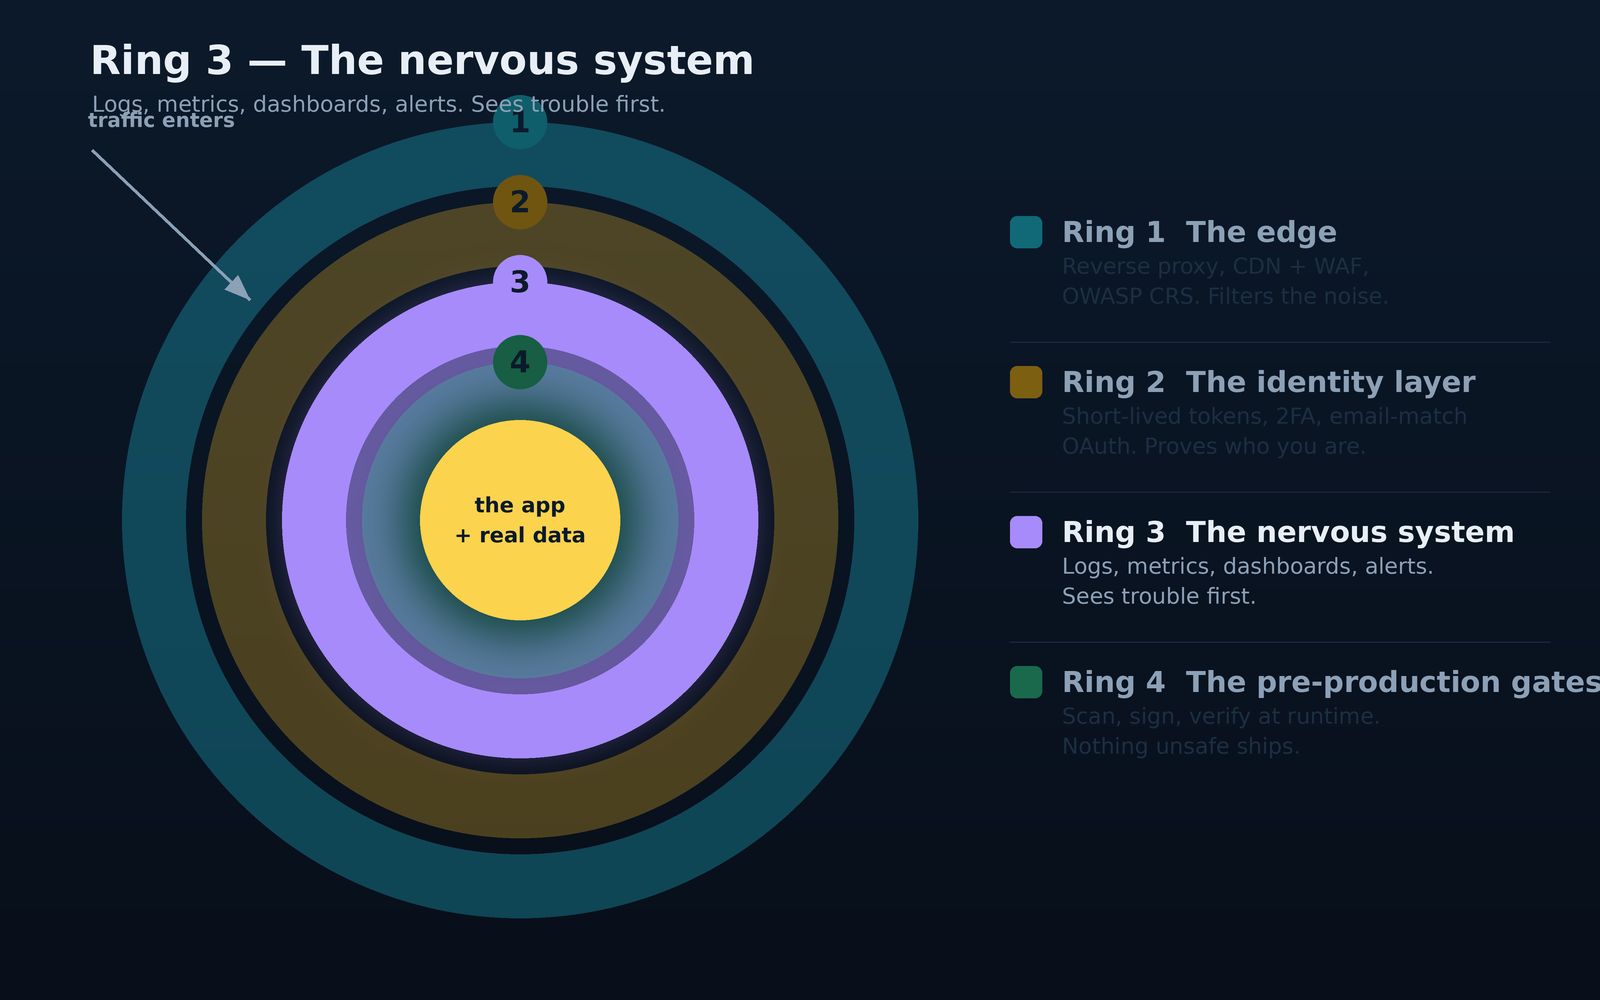
The nervous system
The night I did not know
There was a Wednesday, a few months into running the flagship system in production, when the origin server ran out of disk space. Docker started refusing new writes, then containers started failing health checks, then the whole thing went into a kind of half-down state where the login page would render but nothing behind it would actually respond.
I found out because someone on the team messaged me and said, "hey, the system is being weird." I found out at nine in the evening. The disk had filled up at four in the afternoon.
Five hours. Five hours of the system being visibly broken to everyone who tried to use it, in the middle of the working day, and I was the last person to know. The reason I was the last person to know is that I had no observability. No log shipping. No metric scraping. No alerting. Nothing that would raise a hand and say "hey, look at this now."
That night I did the reasonable thing. I sat on the floor, freed up disk space, wrote a small cron job to prune old images, and went to bed. And in the morning I started planning the thing I should have built six months earlier: a way for the servers to tell me they were in trouble, before the users did.
This piece is the story of what that system looks like now.
Why "just check the logs" is not a strategy
Every engineer who has run a production system for any length of time has gone through this arc. First, you SSH in and tail the log when something feels off. Then you write a bash one-liner that greps for error. Then you copy the one-liner to your notes. Then you notice the one-liner does not run itself. Then you wonder why you have not solved this properly.
The reason "just check the logs" is not a strategy is that it depends on a person remembering to check. That person is you. You will forget. You will be asleep. You will be on a plane. You will be in a meeting. You will be doing literally anything other than tailing the log at the moment the log has something useful to say.
Real observability is the practice of moving that responsibility off yourself and onto the machines. The machines watch themselves, in the way and at the cadence you specify, and they interrupt you only when something warrants your attention. They do not need to sleep. They do not forget. They do not get distracted.
That is the whole game. Everything below is just the mechanics of setting it up in a way a small team can actually maintain.
The shape of it
Here is the picture, kept general enough that it is not a map of any specific network.
There are multiple virtual private servers. The first set of nodes/servers are the origin: it hosts the flagship system, the public website, the internal document store, and everything that faces users. The second one is idle for user traffic. Its whole job is to watch the first one.
Between the two sets are private tunnel, a peer-to-peer encrypted link that does not touch the public internet at the application layer. All observability traffic (log shipping, metric scraping, alert-manager messages) travels over that tunnel. Not because the payload is uniquely sensitive, but because it means the observability plane and the user-traffic plane are physically separate. A denial-of-service on the front door does not take out my ability to see what is happening. And the observability endpoints on server two are not reachable from the public internet at all. No port, no hostname, no way in.
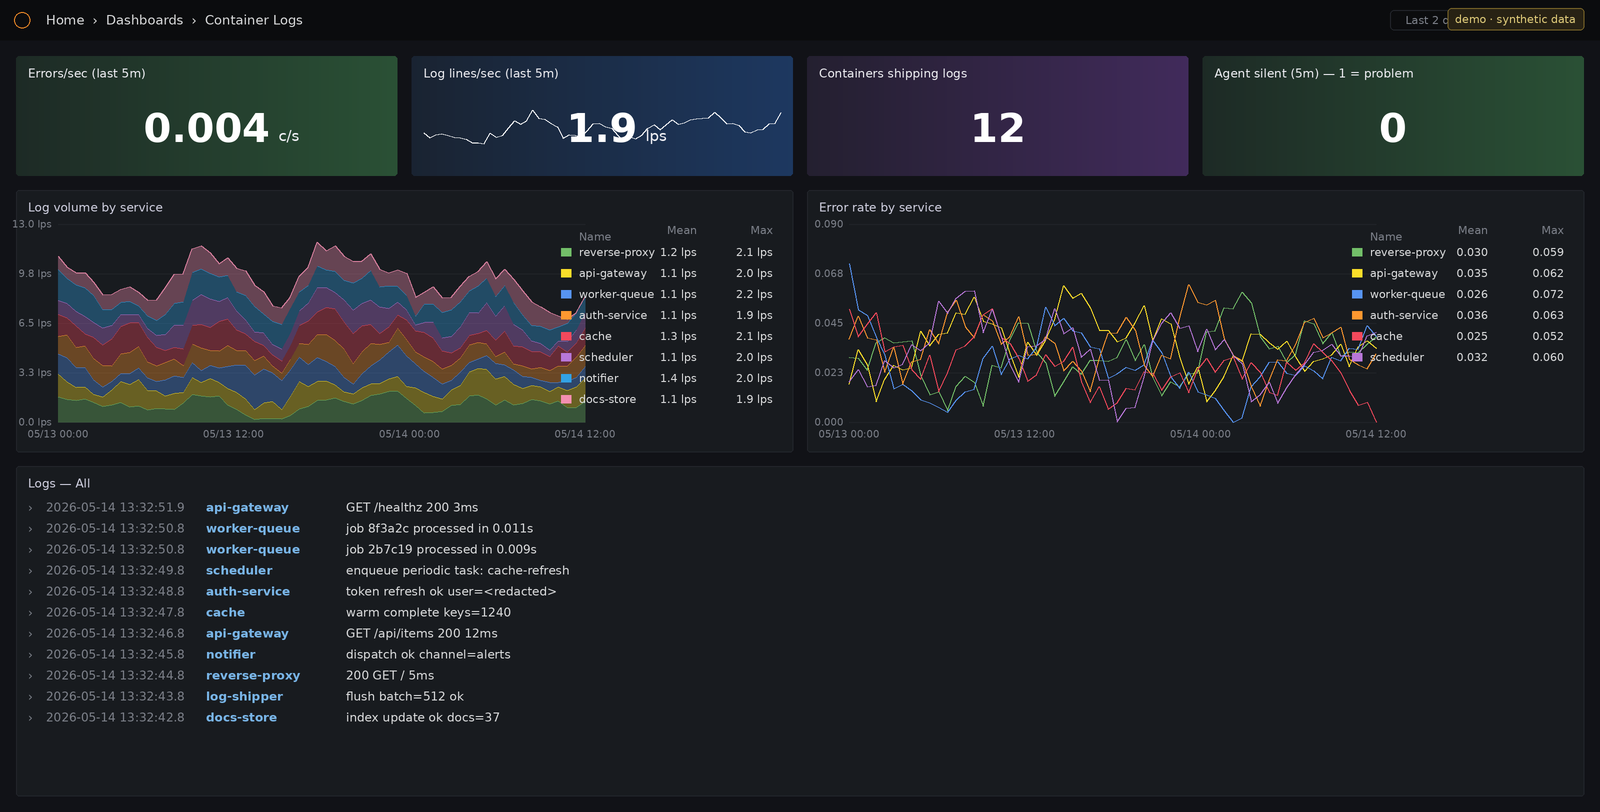
On the origin, a single lightweight agent tails every container's stdout and stderr, adds metadata (which container, which service, which host, which stream), drops anything old enough that it would be rejected downstream, and forwards the rest across the tunnel. That same agent also exports process and container metrics.
On the observability servers, three things run: a log store, a metrics store, and a dashboard tool that queries both. Alongside them is an alert-router service, which subscribes to the metrics store, evaluates rules, and, when a rule fires, pushes a message to a chat channel my phone monitors.
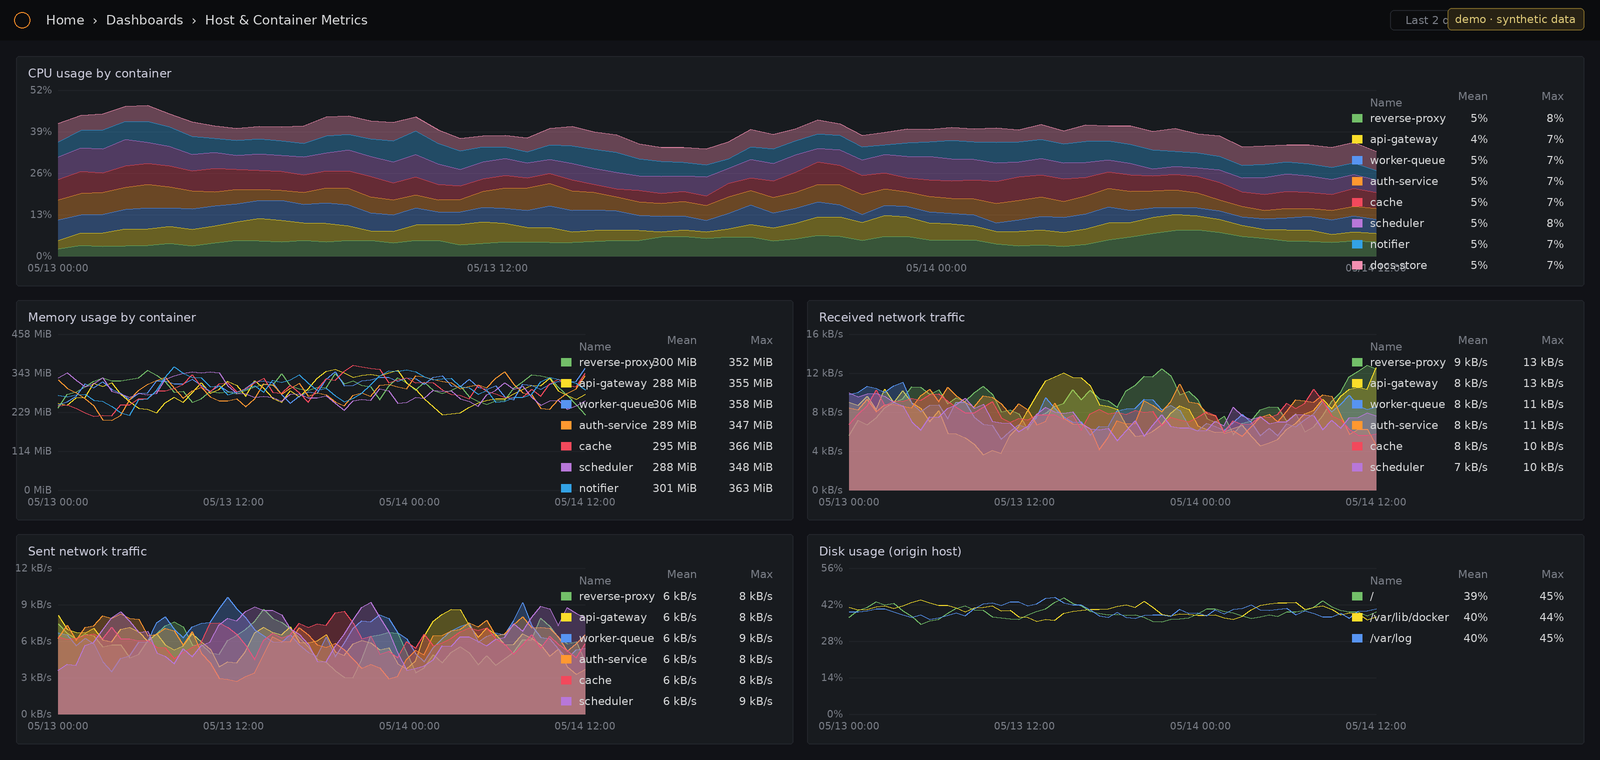
That is it. Log shipper on one side. Log store, metrics store, dashboards, alert router on the other. Private tunnel in between. All open-source, all self-hosted, all commodity components that have been running quietly in serious production environments for years.
The design decisions I would defend
multiple hosts, not one. The observability plane sitting on a different machine is not about scale. It is about survivability. When the origin catches fire, you do not want your monitoring for the origin to be on the origin. The whole point of monitoring is that it keeps working when the monitored thing does not.
A private tunnel, not a public port. The log store and metrics store do not need to accept connections from anywhere on the internet. If they are only reachable from one other server, through a mutually-authenticated tunnel, that is a whole category of exposure that never exists. No misconfigured firewall rule can accidentally expose a service to the world if that service was never bound to a public interface in the first place.
Agent-based log shipping, not sidecar-per-container. A single agent that talks to the Docker socket and enumerates containers means you do not need to remember to add anything when you add a new service. The observability layer just picks it up. The correct default is "if it logs, it gets shipped."
Drop entries older than N hours before shipping. The log store has a rejection policy for out-of-window entries. If the agent starts up after being down for a day, it should not try to backfill a giant window that would fail anyway. Filtering at the source keeps the pipeline healthy and the alert on "logs are being rejected" meaningful.
Dashboards as code, not clicked in the UI. Every dashboard is a JSON file in the repo. The dashboard tool is configured to read them from a directory, refuse UI edits, and refresh on file changes. This means dashboards survive server rebuilds, they diff nicely in code review, and the ownership question is settled: the repo wins, the UI is read-only.
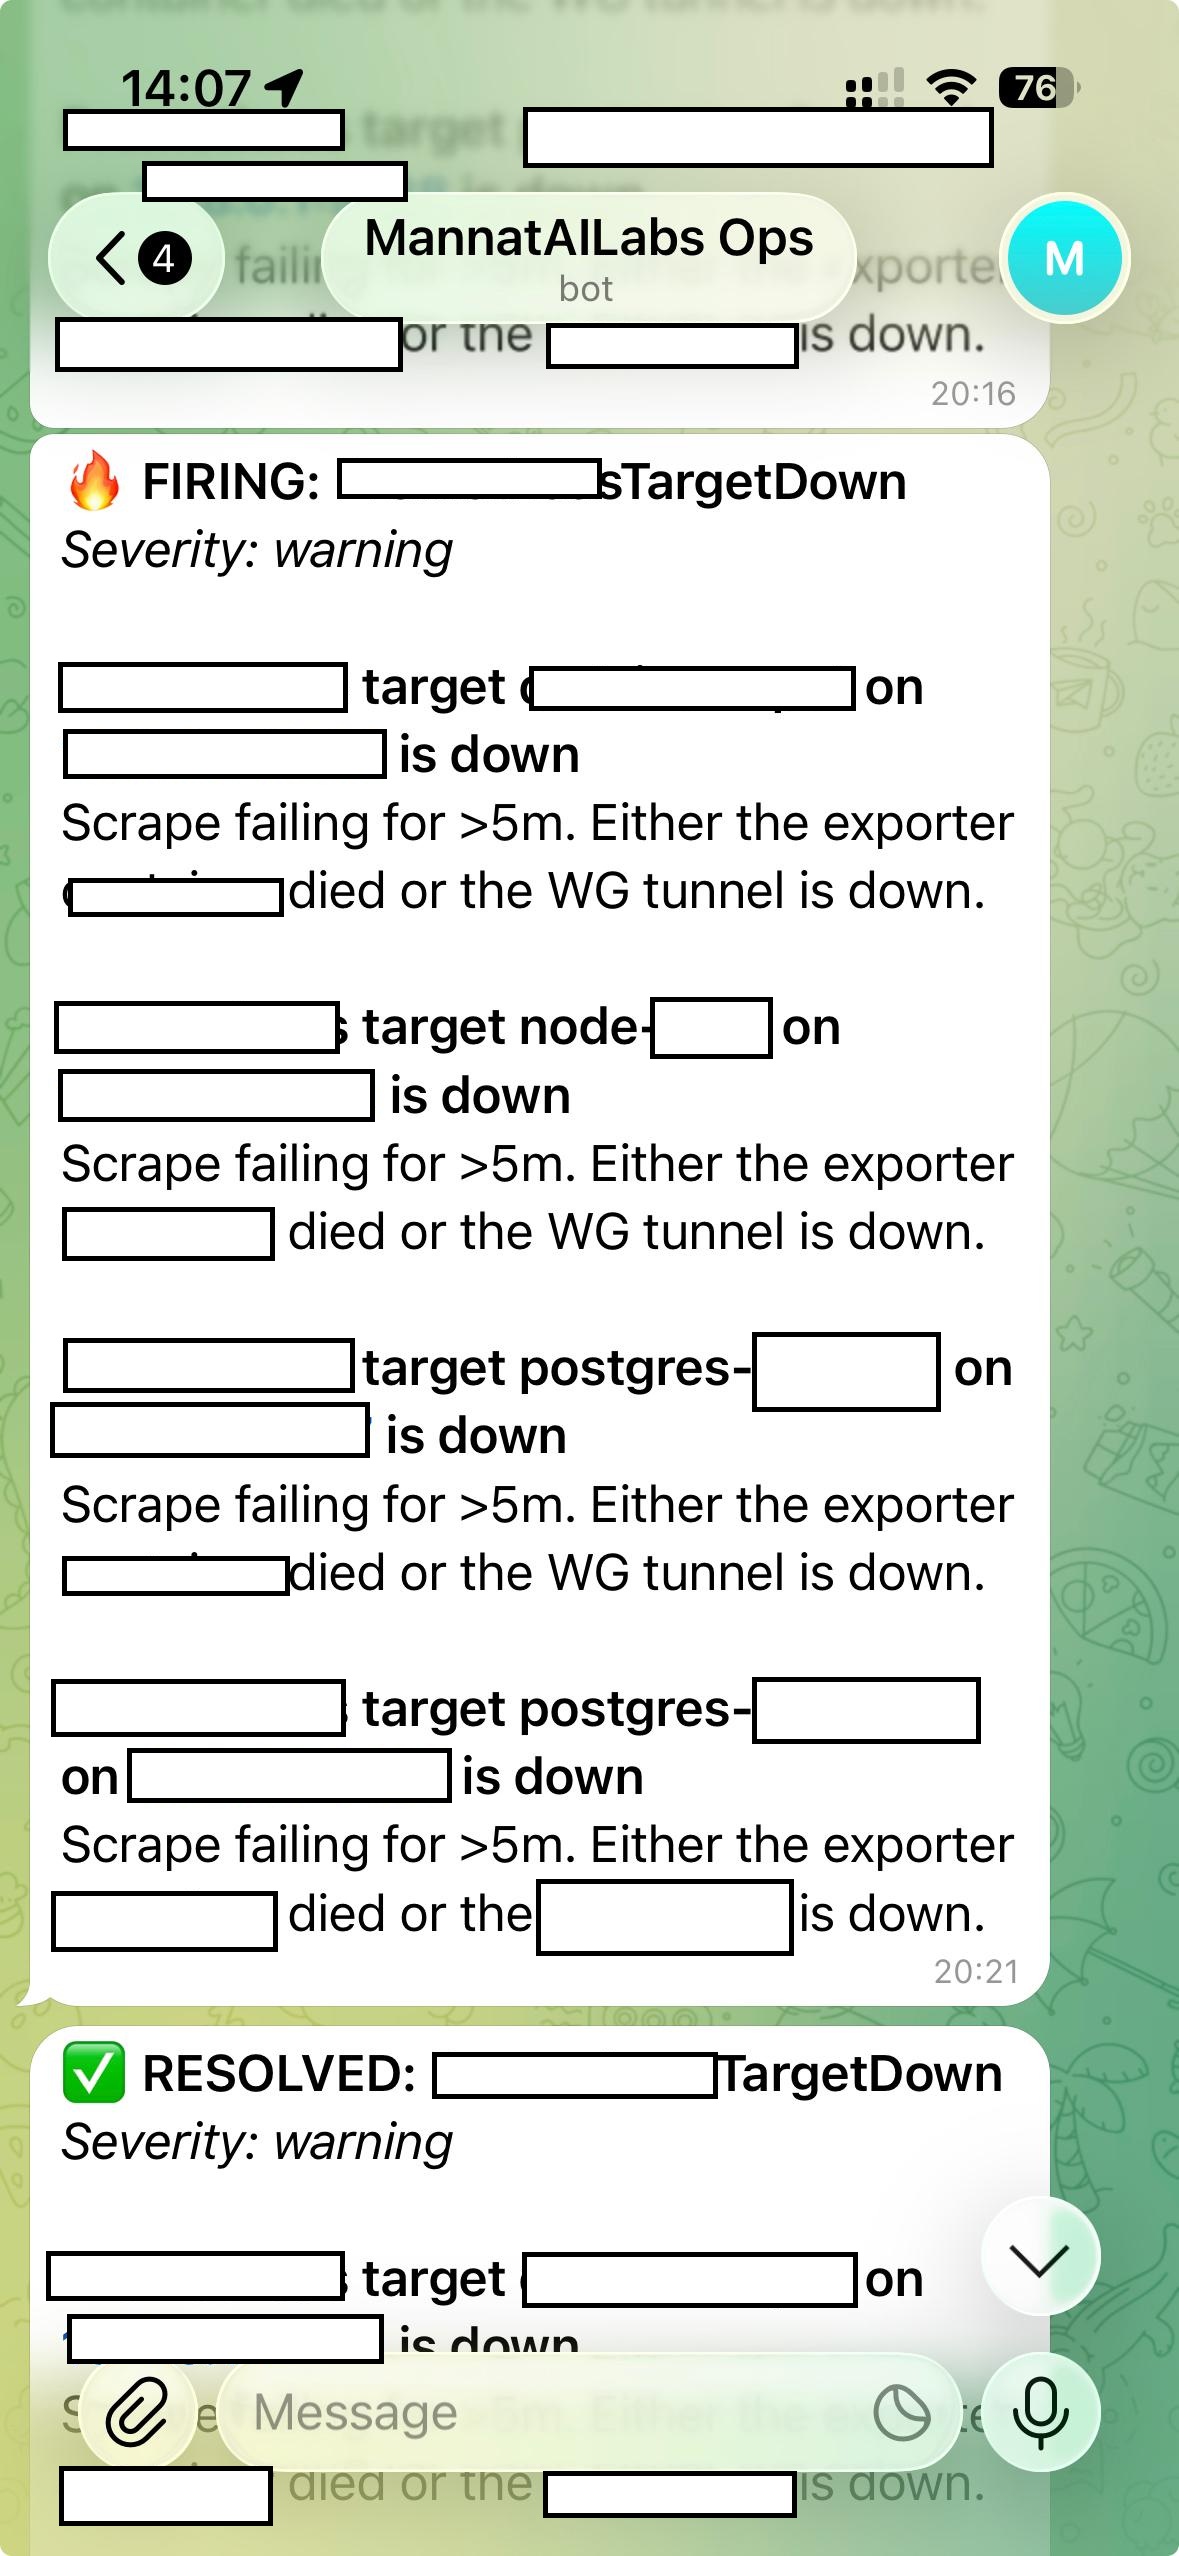
Alert to a chat channel, not to email. Email is where things go to be ignored. A chat channel that specifically holds alerts, with sensible grouping and de-duplication, gets read within minutes because it is not the inbox everyone is already drowning in. It also gives you a distinct place to look when you want history.
Alert on symptoms first, causes later. The first alerts wired up were: disk almost full, host CPU pegged, host memory pegged, a metric scrape target down, database connections nearing max. These are the "a user is about to notice" signals. Cause-level alerts, like a specific service throwing 500s or a specific queue backing up, get added later, once the symptom coverage is trustworthy.
Alert grouping matters as much as alert accuracy. The first version fired every alert individually. A single incident could produce twelve pings in a minute. The current version groups related alerts within a short window, so an incident becomes one interruption, not twelve. This is boring, unglamorous work, and it is what separates useful alerting from noise you eventually mute.
Inhibition rules for cascades. If the host scrape target is down, no per-host metric alert can be trusted, so they get suppressed. Otherwise you get paged twelve times when the real problem is one thing.
The uncomfortable part
Consistent with Parts 1 and 2, the honest inventory.
I recently swapped one log-shipping agent for a newer one from the same vendor. The old agent was reaching end-of-life; the new one is the actively maintained successor. The swap looked clean in staging. In production, it turned out one of the pipeline stages was silently dropping a label that a couple of dashboards depended on for filtering. Nothing was visibly broken. No red on any status page. The dashboards just started returning empty panels for one specific filter, in a way I only noticed a week later when I opened them for an unrelated question.
Fix: added the missing label back to the pipeline, verified all expected labels appear on every entry now, and, because this is exactly the sort of thing a person should not have to notice manually, added a check to the verification script from Part 4 that queries the log store for the label set on the most recent entry and fails if anything expected is missing.
The lesson is not "test better in staging." Staging was fine. The lesson is: silent regressions in the observability plane are a category of bug that is uniquely painful, because the tool you would use to notice them is itself the broken thing. Anywhere you can, put a machine-checkable assertion on the observability pipeline. Do not trust yourself to see a missing dashboard panel.
I also had a second gap: the cleanup of the old log-shipper installation was gated on "wait for stability," which is the kind of open-ended gate that quietly becomes forever. I now have a specific date in the calendar to close that loop, and a specific set of commands to run.
What surprised me
Dashboards as code changed the meaning of a dashboard. When dashboards are things people click together in a UI, they are ephemeral. Nobody feels bad if a dashboard disappears in a database migration. When dashboards are JSON files in the repo, they are artefacts. They get reviewed, discussed, and iterated on. The dashboards became better once the file was the source of truth.
Grouping is a bigger deal than accuracy. I spent the first month tuning alert thresholds. That was wrong. The threshold work was small compared to the grouping work: figuring out which alerts belong together, how long to wait before flushing a group, when to suppress a downstream alert because an upstream one already fired. Good alerting is 20 percent "when to fire" and 80 percent "how to present."
The observability system has to be simpler than the thing it observes. If the monitoring stack has more failure modes than the system it watches, the monitoring stack is a liability. Every additional layer in the observability plane is a layer that can break silently and lie to you. Keep it boring. Keep it small. Keep it built out of components you understand end to end.
Self-hosted is cheaper than the calculator says. People price self-hosted observability by comparing VPS cost to SaaS subscription cost. That ignores the biggest cost of managed observability, which is per-seat licensing that scales with your team.
For a small team, self-hosted is often ten to twenty times cheaper. For a big team, it can be a hundred times cheaper. It is not free, because someone has to keep it running, but the money is not close.
What I deliberately left out
Same discipline as Parts 1 and 2. No hostnames. No IP ranges. No port numbers. No alert-rule thresholds. No specific alert-router configuration values. No chat channel identifiers. No repo paths for the dashboards.
The reason is the same: any of those specifics would help someone probing the infrastructure and would help nobody who is trying to build something similar for themselves. The value is in the shape, not the coordinates.
If you want to build the same thing, the useful pieces to lift are:
- multiple hosts, not one. Observability elsewhere from the thing observed.
- A private tunnel, not public ports, for the internal control plane.
- One agent per host, picking up all containers automatically.
- A log store, a metrics store, a dashboard tool, and an alert router. All commodity, all open-source, all reasonably boring.
- Dashboards as code, in the repo, read-only in the UI.
- Alerts to a chat channel, not email. Grouped, with inhibition rules. Symptoms first, causes later.
- Machine-checkable assertions on the pipeline itself, because silent regressions in observability are the worst kind.
The specific tools you pick matter less than these design shapes. There are three or four viable stacks that would give you the same properties with different names on the boxes. (Mine is the open-source Grafana family. The hashtags below give that much away, and the tool names were never the secret. The coordinates are.)
What's next
- Part 4: The Pre-Production Gates. The fail-closed pipeline every change clears before production, the day it went red five times on a newly onboarded app, how the chain continues past the build with signed artifacts verified at runtime, and the generic verification-script template, adaptable to any stack, that plugs the "did any of this drift?" hole this series keeps coming back to.
If any of this is useful, I am glad. If you have done something better, or seen me miss something obvious, I would rather hear that than a compliment.
A note on context: everything here describes independent projects run under Mannat AI Labs. Views and mistakes are entirely my own.